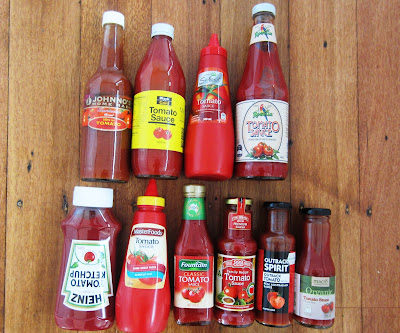
Over the next few weeks students will be conducting a predominantly mathematical investigation into different brands of tomato sauce. This will allow them to focus on nutrition information panels, gain an understanding of milligrams, grams, unit pricing, data collection, the program Excel and the ingredients of tomato sauce, most notably the quantities of sugar, fat and sodium . There are ten brands under scrutiny some of which claim to be organic and healthy. I purchased ten types to make use of percentages a little easier for students. They will also focus on kilojoules. The Spelling Bingo words for this week and next will be words students will be using in their investigations. See Spelling Bingo Sauce Words blog entry for this list:
http://thelittleclassroomuptheback.blogspot.com.au/2012/06/spelling-bingo-words-for-rest-of-july.html
http://thelittleclassroomuptheback.blogspot.com.au/2012/06/spelling-bingo-words-for-rest-of-july.html
Outback Spirit Real Australian Sauce
MasterFoods Tomato Sauce (with reduced salt)
Rosella Tomato Sauce(prepared from the choicest ingredient...apparently)
Fountain Classic Tomato Sauce
Select Tomato Sauce ( a classic rich tomato sauce)
Heinz Tomato Ketchup (Grown not made)
Three 333 Threes Family Recipe Tomato Sauce (Premium Australian Produce)
Organic Tomato Sauce (Gluten free)
Black & Gold Tomato Sauce (Quality Assured)
Johnno's Home Made Tasmanian Brand Tomato Sauce
I have written the cost of each sauce on the base of the bottle and students will need to work out price per 100 grams.
 |
| Ten brands of tomato sauce |
Pre-investigation:
Students read about
information panels and learn how to decode them
As a class we look at mean,
mode, median and the concept of averages and how they can be applied in different
situations.
1. Class pose the mathematical questions we
will be exploring
2. Design a cover page with a catchy heading
to sum up the investigation and clearly state what is under investigation
3. Write up Background
Information
4. Collect Data using tables
looking specifically at fat, sodium, sugar and unit pricing and whatever is needed to answer the posed
questions
5. Enter data into Excel
6. Generate graphs comparing
the sauces
7. Write up a discussion
8. Reference and acknowledgments
page
Watch this space for further
developments.
Update 15/0512
 |
| Collecting data |
 |
| Tabling fat, sugar, sodium content per 100ml |
 |
| Comparing data to ensure accuracy |
 |
| Unit pricing |
 |
| Collecting data |
 |
| Using Excel to table up the information |

No comments:
Post a Comment